An overheating electrical cabinet can halt an entire plant in seconds. Low-resolution thermal cameras easily miss these failures by blurring critical hotspots into safe-looking temperature averages.
In our view, genuine facility protection comes from matching detector resolution directly to your inspection distances without paying bloated vendor markups. This thermal imaging resolution guide outlines the essential sensor choices across our cost-effective QualiTC lineup.
Key Takeaways
- Total pixel density dictates your diagnostic clarity: values scale from 10,800 active measurement points (120×90) for routine walkthroughs up to 307,200 pinpoint pixels (640×480) for advanced industrial troubleshooting.
- Temperature accuracy is never a single-pixel task: obtaining dependable numbers requires your target area to cover a cluster of at least 3×3 pixels (Measurement Field of View) rather than touching a solitary pixel (Instantaneous Field of View).
- Standoff distance distorts sensor readings: stepping farther back systematically pulls down temperature figures, meaning you need sufficient physical resolution or optical tools to maintain safety and precision.
- Recognized US standards directly shape camera selection: NFPA 70B and NFPA 70E dictate electrical audit intervals and safe standoff perimeters, while ASTM C1060 and ASTM E1186 govern building envelope inspections.
- Every handheld model in our lineup comes equipped with dedicated PC analysis software, multi-language menus, and selectable color palettes right out of the box.
Thermal Resolution and Distance-to-Spot Fundamentals
Getting a firm grip on the right camera means breaking down how sensor pixel density, optical beam spreading, and target dimensions interact across distance.
Sensor Architecture and Pixel Density
Thermal imaging sharpness depends on detector pixel count, the physical spacing between pixels, optical beam spreading, and the constant balancing act between spatial clarity and total field of view. Industrial thermography instruments rely on microbolometer grids typically ranging from 80×60 to 1024×768 pixels, where the physical footprint of each microscopic sensor element sets a firm ceiling on achievable detail.
Traditional 90 micrometer pixel gaps held thermopile grids below 10,000 pixels, whereas tighter 60 micrometer and 45 micrometer footprints moved arrays into significantly higher detail above 10,000 pixels. But a fundamental trade-off exists: reducing pixel dimensions to gain spatial sharpness decreases the signal-to-noise ratio, making hardware-level sensor development technically demanding and capital-intensive.
Across commercial plant instruments, pixel counts scale across distinct tiers:
- 120×90 Resolution: 10,800 active measurement pixels
- 220×160 Resolution: 35,200 active measurement pixels
- 256×192 Resolution: 49,152 active measurement pixels
- 320×240 Resolution: 76,800 active measurement pixels
- 384×288 Resolution: 110,592 active measurement pixels
- 640×480 Resolution: 307,200 active measurement pixels
Moving from an entry-tier 120×90 sensor to an advanced 640×480 array provides more than 28 times the data points per capture. In our assessment, buyers frequently evaluate total pixel count while overlooking optical fidelity.
Research indicates that standard one-dimensional benchmarks like Instantaneous Field of View (IFOV) fail to account for intrapixel sensitivity variations and fill-factor discrepancies (such as 0.963 versus 0.996 between sensor classes), which create unwanted artifacts in high-contrast targets.
While thermal sensitivity ratings like Noise Equivalent Temperature Difference (NETD) define a sensor's ability to distinguish subtle temperature differences, they do not indicate whether the optical lens and detector can separate two closely spaced physical hotspots. Infrared physics can also obscure surface texture in pure thermal emissions, a challenge researchers have addressed by analyzing multiple thermal spectral bands.
Thermal Sensitivity (NETD): The Thermal Contrast Axis
If detector resolution determines whether your camera can visually outline a target, Noise Equivalent Temperature Difference (NETD) determines whether it can detect subtle temperature differences across that target. Measured in millikelvins (mK), a lower NETD value denotes a more sensitive detector capable of identifying smaller temperature shifts.
In general industry applications, high resolution without adequate sensitivity produces crisp outlines of thermal features with poor temperature distinction.
Conversely, high sensitivity with low pixel counts allows detection of faint temperature shifts that cannot be accurately located from a distance.
Across our QualiTC lineup, thermal sensitivity does not follow pixel count in a linear fashion:
- The 256×192 QualiTC 17 and QualiTC 20 deliver a sensitivity of 50 mK at 25°C, resolving temperature differences down to 0.05°C.
- The 320×240 QualiTC 25 provides higher spatial resolution with a sensitivity rating of 70 mK at 25°C (resolving 0.07°C differences).
- The 640×480 QualiTC 64 combines flagship spatial resolution with advanced sensitivity rated at 45 mK or better at 25°C.
Because the 256×192 QualiTC 17 provides higher thermal sensitivity than the 320×240 QualiTC 25, equipment selection depends on target characteristics.
For low-temperature-difference applications like building insulation voids, concealed moisture, or early-stage bearing friction, thermal sensitivity is paramount. For dense electrical cabinets and distant overhead connections, spatial resolution takes priority. Evaluating both metrics ensures you select the proper instrument for your diagnostic tasks.
Distance to Spot Ratio Thermal Camera Calculations
When sizing up a distance to spot ratio thermal camera setup, technicians evaluate how far back they can remain while acquiring dependable thermal figures. The core calculation is:
D:S = Distance to Target / Spot Diameter
Securing an accurate temperature reading requires separating two distinct concepts:
- Instantaneous Field of View (IFOV): The narrow angular view seen by a single pixel at a specific distance, which defines the smallest physical anomaly the camera can visually detect.
- Measurement Field of View (MFOV): The actual surface area your target must cover to yield an accurate temperature reading. Because perimeter pixels blend thermal energy with adjacent backgrounds, sound thermography practice demands that the target span a tight cluster of at least 3×3 pixels. For compact targets, the view of a single detector pixel must be strictly smaller than the observed face to prevent significant calculation errors.
Standoff Distance and Measurement Accuracy
Target distance directly affects measurement integrity because pixels cover broader surface areas as distance increases, blending contrasting temperatures into a diluted, averaged readout. Rigorous testing confirms that increasing camera-to-target distance systematically underreports surface temperatures and flattens real-world thermal contrast.
In controlled trials, extending distance from 50 cm to 100 cm doubled measurement error on compact subjects, dragging down readings between -1.36°C and -2.65°C, while larger subjects with broader surface areas maintained significantly closer agreement (+0.16°C to -0.76°C). Field researchers identified an intermediate distance plateau (40 to 80 cm for compact biological subjects) that balances solid pixel coverage against atmospheric interference.
In outdoor long-range assessments, thermal readings degrade quickly up to a critical distance threshold of approximately 20 meters, with sun-exposed surfaces underestimated by roughly 3.3 K at 40 meters compared to 1.5 K on cooler backgrounds.
Direct hardware comparisons confirm that native sensor density remains paramount. In clinical assessments across 20 distinct test regions, high-performance instruments (such as the reference FLIR A655SC and the 320×240 FLIR E60, which varied by only -0.19 ± 0.55°C) substantially outperformed lower-resolution units like the FLIR One Pro, which missed targets by -1.3 ± 3.4°C and showed poor consistency.
Similarly, evaluations matching the 320×240 SEEK Compact PRO against lower-resolution alternatives verified that higher native resolution yields crisper thermal detail and superior diagnostic confidence.
Display presentation also influences user perception: empirical data indicates that high-contrast iron-red or rainbow palettes function best on lower-density screens (120 to 256 ppi), while subtle greyscale palettes provide clearer clarity on high-resolution displays.
Arc Flash Boundaries and Target Resolution
We believe it is an error to treat distance calculations as a purely theoretical exercise. On American manufacturing floors, NFPA 70E safety rules establish two distinct physical perimeters around energized gear. Shock protection defines a limited approach boundary based strictly on voltage (3 feet 6 inches for fixed components and 10 feet for exposed movable conductors on 50V to 750V systems).
Separately, the arc flash boundary is calculated from available fault energy, often keeping personnel well back from typical 18-inch working distances. From our perspective, maintaining high sensor resolution across these required standoff distances is an essential safety requirement rather than an optional equipment feature.
Consider checking a 1-inch (25 mm) terminal lug from a representative 10-foot (about 3 meters) safety standoff outside a calculated arc flash boundary:
- At 120×90 resolution, a single pixel covers an area comparable to the entire 1-inch lug at a 10-foot distance. Because the target covers only about one pixel, it falls far short of the 3×3 pixel cluster required by the MFOV rule, blending component heat with the cooler cabinet interior and displaying an artificially low temperature that obscures a developing failure.
- At 256×192 or 320×240 resolution, that same lug covers several adjacent pixels, allowing center pixels to isolate the component surface without background temperature dilution.
- At 384×288 or 640×480 resolution, the lug spans dozens of dedicated pixels, enabling technicians to examine heat profiles across the bolt head, crimp sleeve, and conductor insulation simultaneously from a protected position.
Computational Enhancement vs. Native Sensors
Because producing large microbolometer wafers involves considerable expense, researchers have evaluated software-based approaches to enhance image detail.
Techniques such as Guided Super-Resolution (GSR) pull high-frequency structural details from visible cameras to sharpen thermal inputs, utilizing cross-spectrum transformers to upscale imagery by factors of 8x and 16x. Meanwhile, mathematical deconvolution algorithms have demonstrated notable laboratory gains, raising an entry-tier camera's optical transfer from 1.1 to 4.8 cycles/mm to distinguish 1 mm features.
Hardware-oriented modifications have also been explored. Researchers have fitted extension rings between camera bodies and lenses to achieve sub-100 micrometer per pixel detail for circuit analysis. Other experimental configurations explore tunable metalenses providing 2K resolution across an ultrawide 120° FOV, active laser-spot thermal systems, and panoramic image stitching to produce 50-megapixel radiometric mosaics.
From our perspective as an instrumentation provider, software super-resolution serves as a helpful visual aid. However, we maintain that relying on algorithmic approximation for critical electrical or mechanical safety decisions introduces unnecessary risk.
Academic findings support this view, confirming that computational processing cannot fully duplicate the calibrated precision and thermal accuracy of native, high-resolution hardware.
US Standards and Application Selection Matrix
Matching thermal resolution to specific operational demands ensures compliance with US technical protocols without overspending on excess hardware.
Regulatory and Safety Frameworks
Electrical Maintenance and Safety (NFPA 70B & 70E): In our view, making NFPA 70B a mandatory standard represents a critical step forward for industrial safety, replacing irregular checks with systematic thermal inspection schedules. While NFPA 70B mandates regular thermographic surveys on electrical distribution gear, NFPA 70E defines strict approach boundaries to protect electricians from arc flash hazards. Pairing cameras with dense pixel arrays, integrated laser rangefinders, or software distance compensation tools lets inspectors evaluate overheating lugs while planted safely behind boundary lines.
Building Envelopes and Energy Auditing (RESNET, ASTM, ASHRAE): Evaluating building performance requires inspecting insulation integrity under ASTM C1060 and detecting air leakage pathways under ASTM E1186, using baseline performance targets from ASHRAE 90.1. In our assessment, blending visible images with thermal data is indispensable here, yielding clear, verifiable documentation that facility directors and insurance adjusters can quickly evaluate.
Industrial Process and Workplace Safety (OSHA): Operating under OSHA Process Safety Management (PSM) rules requires rigorous mechanical integrity monitoring of high-hazard assets. For processing furnaces, flare stacks, high-temperature steam lines, and refractory walls operating up to 1200°C, inspection teams rely on continuous radiometric video and laser-assisted distance tracking to document critical thermal patterns while keeping technicians clear of extreme heat hazards.
Field Scenarios Across US Industry
In Midwestern industrial facilities, preventive maintenance programs rely on routine NFPA 70B thermography audits across 480V motor control centers and primary switchgear.
Plant electricians must locate loose busbar bolts and phase load imbalances during active production cycles. Mid-tier resolutions (such as 256×192 or 320×240) supply the spatial clarity needed to inspect bolted connections from designated walkways without interrupting plant operations.
For energy auditors and building specialists operating across diverse US climate zones, inspection challenges shift with regional weather. In northern states (IECC Climate Zones 5 and 6), auditors conducting ASTM C1060 and ASTM E1186 surveys use thermal imaging during winter months to locate insulation voids, structural steel thermal bridges, and building envelope air leakage against ASHRAE 90.1 baseline targets.
In southern locations (IECC Climate Zone 2), technicians evaluate cooling duct leaks and hidden condensation behind drywall before moisture leads to microbial growth.
Along the US Gulf Coast refining corridor, facilities subject to OSHA Process Safety Management (PSM) rules manage severe thermal assets continuously. Inspection teams monitor flare headers, high-pressure steam distribution mains, and reactor vessels operating at temperatures up to 1200°C.
These demanding environments require high-resolution sensors, broad temperature spans, and integrated distance rangefinders so crews can acquire exact readings while maintaining safe standoff positions.
QualiTC Selection Matrix
| Application & Standard | Inspection Focus | Recommended Model & Resolution |
|---|---|---|
| Residential & Light Commercial (NFPA 70B Routine PM) |
Overheated branch breakers and distribution panels | QualiTC 10 / 15 (120×90 IR, close range within 2m) |
| Facility & Building Envelopes (RESNET / ASTM C1060 / ASTM E1186 / ASHRAE 90.1) |
Insulation voids, air infiltration, and pipe leaks | QualiTC 17 / 20 (256×192 IR) |
| Distributed HVAC Maintenance (Regional Mechanical Codes) |
Compressor heat, duct leaks, and wireless reporting | QualiTC 23 / 25 (220×160 to 320×240 IR) |
| Utility Substations & Lines (IEEE / NERC / NFPA 70B) |
High-voltage disconnects requiring safe standoff | QualiTC 38 (384×288 IR, 40m Rangefinder) |
| Petrochemical & Process Monitoring (OSHA Process Safety Management) |
High-temperature piping and reactors up to 1200°C | QualiTC 64 (640×480 IR, Radiometric Video) |
Selecting by Operating Distance: Entry-level 120×90 models are matched to routine panel inspections that allow safe approach within 2 meters, which aligns directly with the boundary of their atmospheric distance compensation.
When inspection protocols or electrical safety boundaries require standing back 10 feet (about 3 meters) or more from energized switchgear, stepping up to a 256×192 or 320×240 detector is necessary to place adequate measurement pixels across small terminal targets.
Thermal Camera Resolution Comparison: QualiTC Specifications
In this thermal camera resolution comparison, we present the practical parameters of our commercial QualiTC handheld instruments. While academic research investigates laboratory prototypes and theoretical models, our instruments deliver calibrated, factory-tested hardware configured for immediate field use.
Every handheld camera in our lineup includes dedicated PC analysis software for offline data evaluation, temperature span tuning, and formal report generation, along with multi-language interfaces and eight selectable color palettes.
Entry-Level Inspection Systems (120×90)
We strongly disagree with the notion that entry-tier thermal cameras are compromise units. When used within their optical boundaries, they provide a cost-effective, dependable first line of defense for routine facility sweeps:
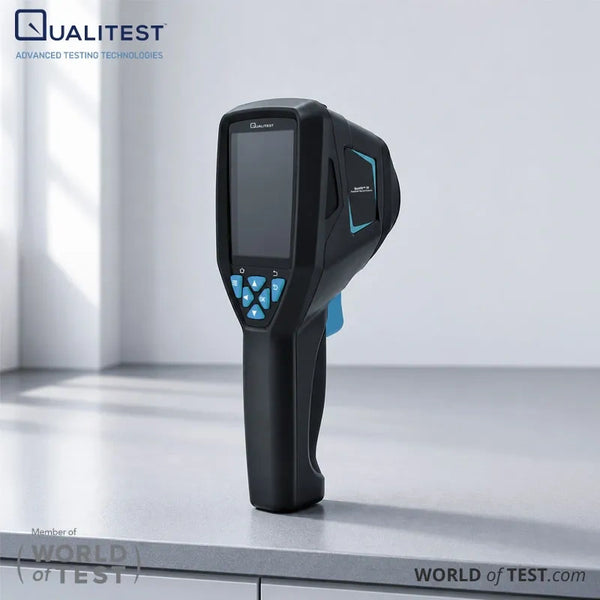
QualiTC 10: Features a 120×90 infrared sensor reading temperatures from -20°C to 550°C. Built as an infrared-only tool with 8GB of internal storage, an integrated laser pointer, and full-screen hotspot tracking, it handles standard checks on breaker panels, HVAC coils, and mechanical drives.
QualiTC 15: Maintains the 120×90 thermal array and -20°C to 550°C measurement range while incorporating a 720P visible light camera. It delivers outline fusion, overlay fusion, picture-in-picture modes, a high-temperature alarm, and automatic high/low tracking.
Fueled by a rechargeable 2600 mAh lithium battery providing approximately four hours of operation, it features atmospheric distance compensation calibrated within 2 meters, weighs 310 grams, measures 70 × 80 × 200 mm, charges via USB Type-C, and operates in conditions from -10°C to 60°C.
Mid-Range Diagnostic Imagers (220×160 to 256×192)
Mid-range pixel density offers the visual clarity necessary for building inspections and dense electrical panels:
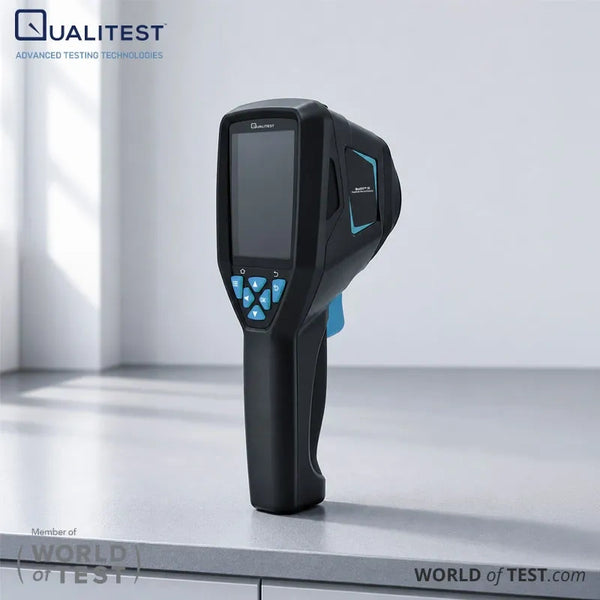
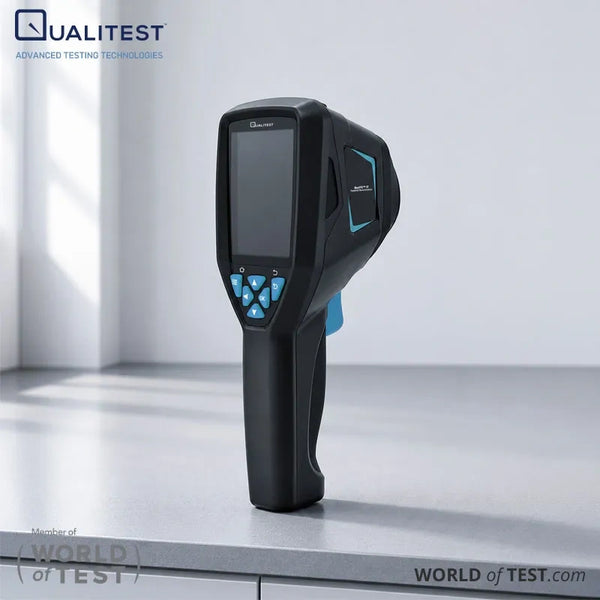
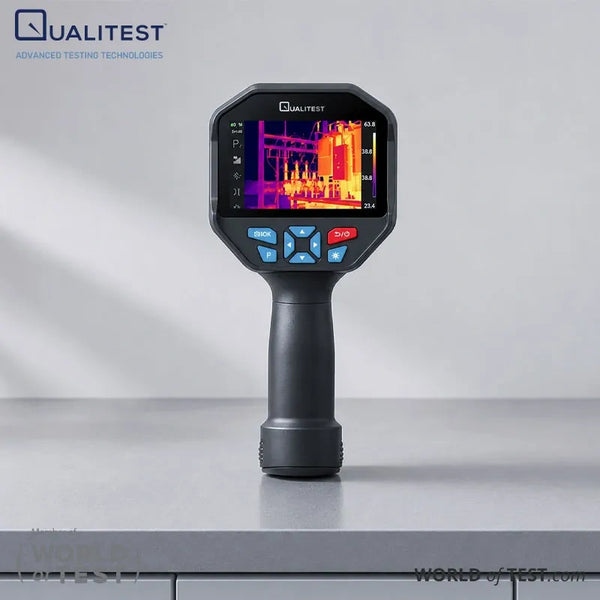
QualiTC 17: Combines a 256×192 thermal sensor with a sensitive 50 mK NETD rating, a 720P visible camera, and a smooth 25Hz refresh rate that maintains clear real-time imaging during walkthroughs. It measures from -20°C to 550°C, provides distance compensation extending to 5 meters, and includes outline fusion, overlay fusion, 8GB memory, USB Type-C connectivity, and a 2600 mAh battery (~4 hours runtime) within a 310 grams housing.
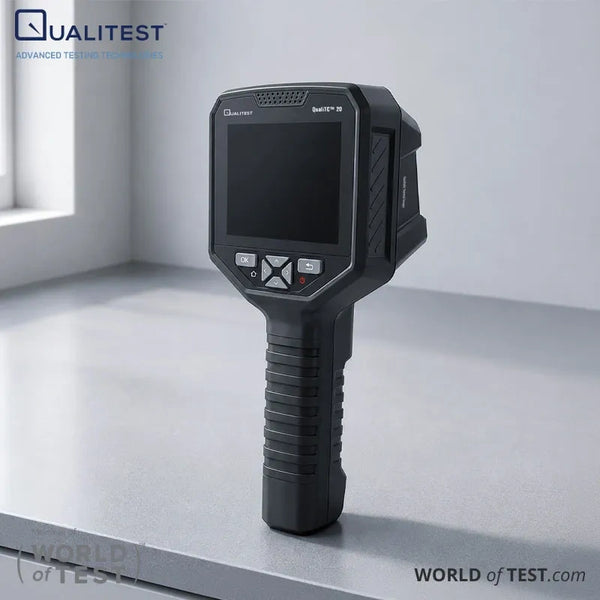
QualiTC 20: Pairs the 256×192 infrared sensor and 50 mK NETD sensitivity with a 720P visible camera and a 3.5-inch display, the largest screen in our handheld series. It features a wide 83° by 55° visible field of view, distance compensation up to 5 meters, a -20°C to 550°C span, 8 custom color palettes, 11 languages, 8GB storage, and an operating envelope of -10°C to 60°C.
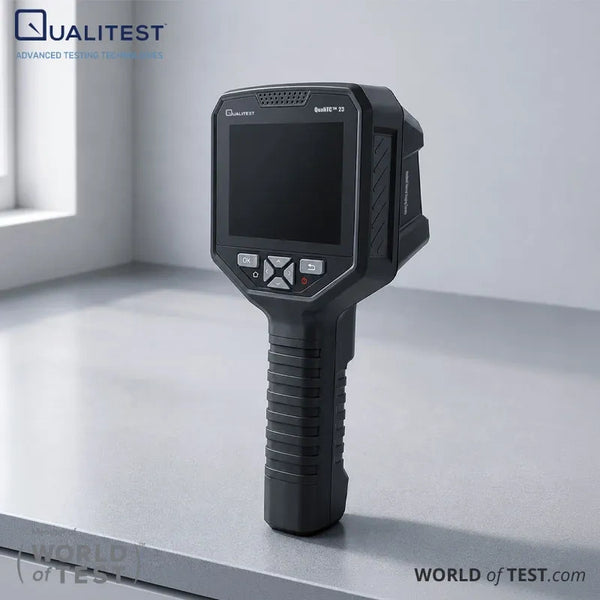
QualiTC 23: Features a 220×160 thermal array spanning -20°C to 450°C. Engineered for collaborative teams, it includes onboard WiFi image transmission and raw TIFF file export, allowing technicians to retain uncompressed radiometric data for detailed office review.
High-Definition Maintenance Systems (320×240)
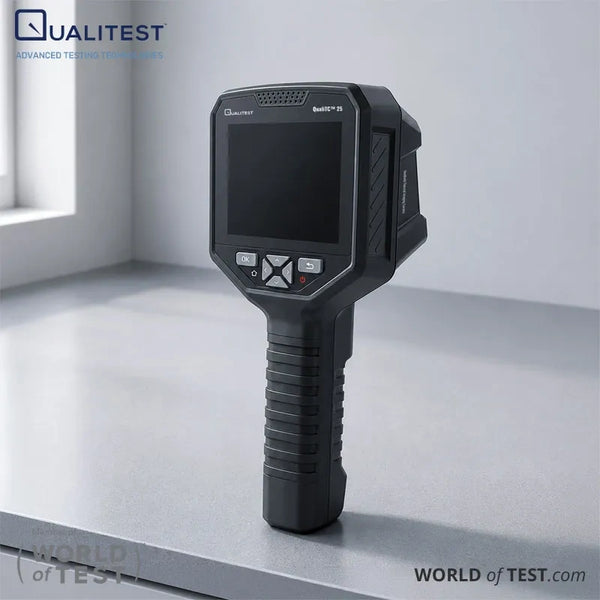
QualiTC 25: Built with a 320×240 long-wave infrared microbolometer grid operating from 8 to 14 micrometers with a 70 mK NETD rating, accompanied by a 640×480 visible camera and a 9Hz refresh rate.
It measures from -20°C to 450°C with full-frame, center-point, cold-spot, and custom regional scanning modes. Housed in an IP54 dust and splash enclosure, it runs on a 4800 mAh battery rated for approximately four hours, exports raw TIFF files, and supports WiFi transfer paired with full-pixel temperature analysis software.
Professional and Flagship Systems (384×288 to 640×480)
For large utility switchyards, chemical installations, and severe thermal assets, we believe investing in flagship resolution represents sound risk management rather than an unnecessary expenditure:
QualiTC 38: Provides a 384×288 thermal array with an extended temperature ceiling of -20°C to 1200°C. It integrates an onboard 40-meter laser rangefinder for accurate standoff calculations, GPS location tagging, 4G cellular connectivity, full-frame radiometric video capture, and a removable 5000 mAh lithium battery pack delivering approximately five hours of continuous field runtime.
QualiTC 64: The premier model in our handheld lineup, pairing a 640×480 thermal array with an 8-megapixel visible camera. Measuring from -20°C to 1200°C, it features uncompressed radiometric video recording, GPS coordinates, an IP54 industrial enclosure, and a detachable USB-chargeable battery pack configured for extended inspection shifts.
Interchangeable Optics and Standoff Distance: Physical optics dictate measurement capability just as much as detector pixel count. For long-distance outdoor utilities and process infrastructure, the QualiTC 38 includes a standard 15 mm F/1.0 lens with optional 19 mm and 25 mm configurations.
The flagship QualiTC 64 ships with a 25 mm F/1.0 lens and supports optional 19 mm wide-angle and 35 mm telephoto optics. Both models feature 1x to 8x electronic display zoom for on-screen inspection.
From an optical physics standpoint, selecting a longer focal length physically narrows your Instantaneous Field of View (IFOV). This allows utility crews to resolve small overhead connections from a safe substation fence line with true optical precision, achieving accurate temperature measurement without relying on digital interpolation.
Select the Right Thermal Camera with Qualitest
Selecting the appropriate thermal resolution aligns facility safety with sensible capital allocation.
We believe dependable thermal inspection programs rest on well-matched hardware rather than inflated vendor specifications. We supply cost-effective thermal imagers engineered for field reliability, from routine electrical panel scans to high-temperature utility diagnostics.
Contact the Qualitest team today to discuss your specific inspection requirements, review detailed technical sheets, and receive pricing and delivery schedules.
References (Click to expand)
- Damien, R., Laurent, S., Laurent, G., Kamel, M., Jean-Luc, B., & Nicolas, H. (2025). Influence of infrared camera resolution and operator reproducibility in the assessment of skin temperature of the hands. Case Studies in Thermal Engineering.
- Dziarski, K., Hulewicz, A., & Krawiecki, Z. (2019). Selection of the size of field of view in thermal imaging observations of small areas. ITM Web of Conferences.
- Faye, E., Dangles, O., & Pincebourde, S. (2016). Distance makes the difference in thermography for ecological studies. Journal of Thermal Biology, 56, 1-9.
- Lai, F., Kandukuri, J., Yuan, B., Zhang, Z., & Jin, M. (2018). Thermal Image Enhancement through the Deconvolution Methods for Low-Cost Infrared Cameras. Quantitative Infrared Thermography Journal, 15, 223-239.
- Selnesaunet, G. M., & Skauli, T. (2025). Measuring the pixel sampling point spread function and effective fill factor of thermal cameras using tomographic reconstruction. Optical Engineering, 64, 123104.