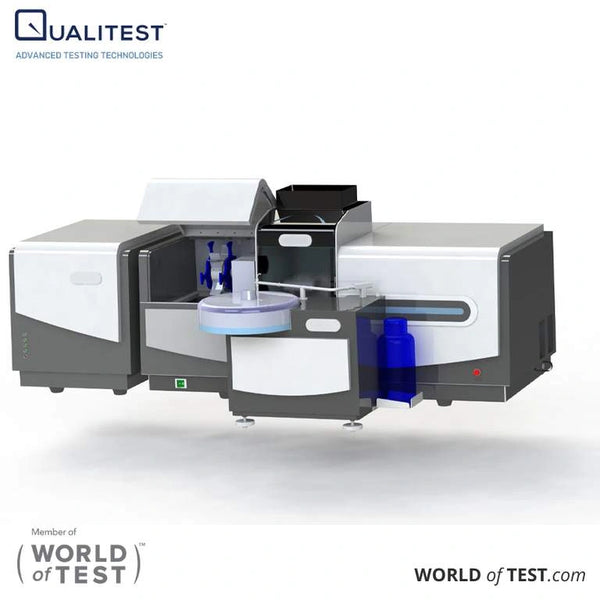
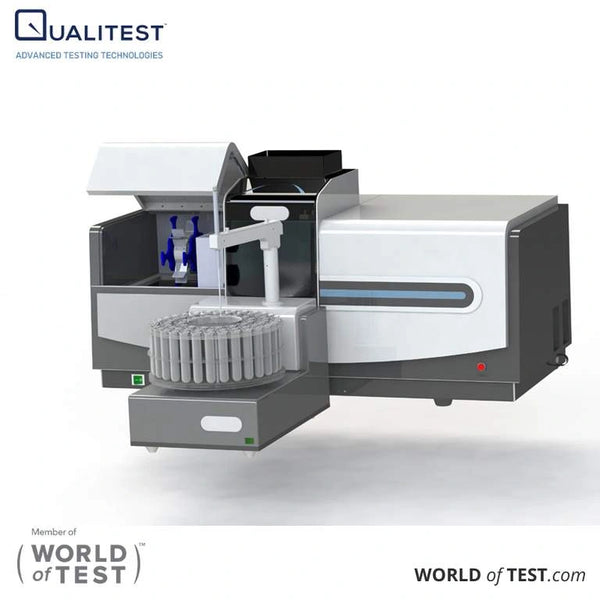
Selecting between AAS vs ICP OES is a defining investment for any growing analytical testing facility. Your decision directly dictates daily sample throughput, trace detection reach, and routine operating overhead for years to come.
This guide delivers a clear, objective breakdown of the core technical and financial criteria so you can choose the ideal platform with complete confidence.
Executive Comparison: AAS vs. ICP-OES at a Glance
For laboratory directors and procurement teams seeking a rapid technical overview, the operational profiles of both platforms compare as follows:
| Decision Factor | Atomic Absorption Spectrometry (AAS) | Inductively Coupled Plasma (ICP-OES) |
|---|---|---|
| Best-Fit Testing Profile | Targeted, routine analysis of dedicated single elements or small panels (1–4 analytes per sample) | High-volume screening requiring simultaneous analysis across multi-element panels (5+ analytes per sample) |
| Sample Throughput Pace | Sequential measurement; cycles through individual hollow cathode lamps per element | Simultaneous full-spectrum acquisition; captures all target elements in a single detector exposure |
| Detection Sensitivity Reach | Parts-per-billion (ppb) to parts-per-trillion (ppt) range (mode dependent) | Parts-per-billion (ppb) trace levels under axial optical viewing |
| Matrix Suitability | Aqueous solutions, soils, raw pharmaceutical materials, fuels, and cannabis products | Aqueous and organic solutions, volatile organic solvents, heavy sludges, and high-salinity brines |
| Facility & Operating Overhead | Low utility overhead using air, acetylene, and argon; compatible with standard 110V/220V electrical circuits | Ongoing argon gas supply required to sustain plasma discharge; higher electrical utility demand |
| Regulatory & Method Alignment | Documented for EPA, ISO 15586 (water by GFAAS), USP, EP, FDA 21 CFR, and state cannabis limits | Industry-standard platform for ASTM D1976 and EPA water methods; factory application packages Not Documented |
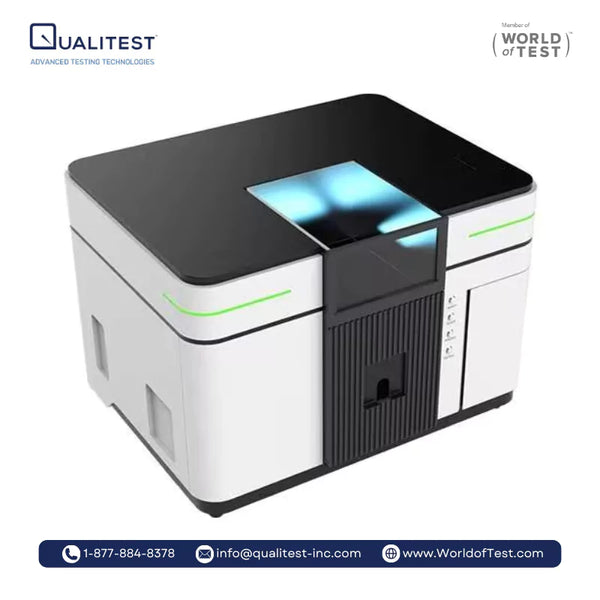
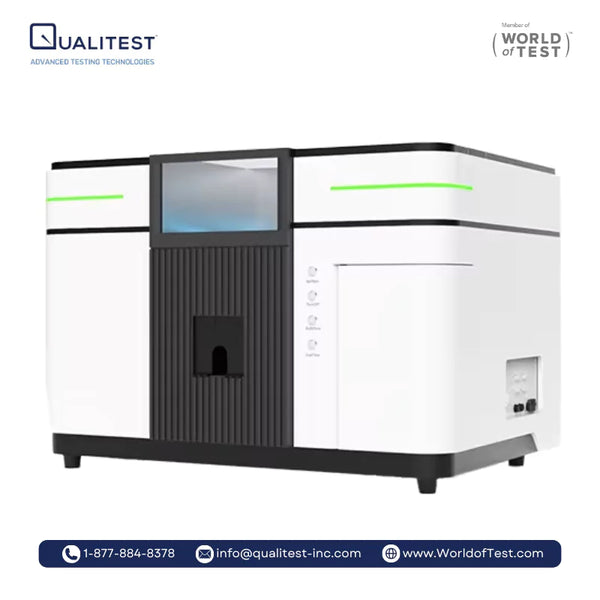
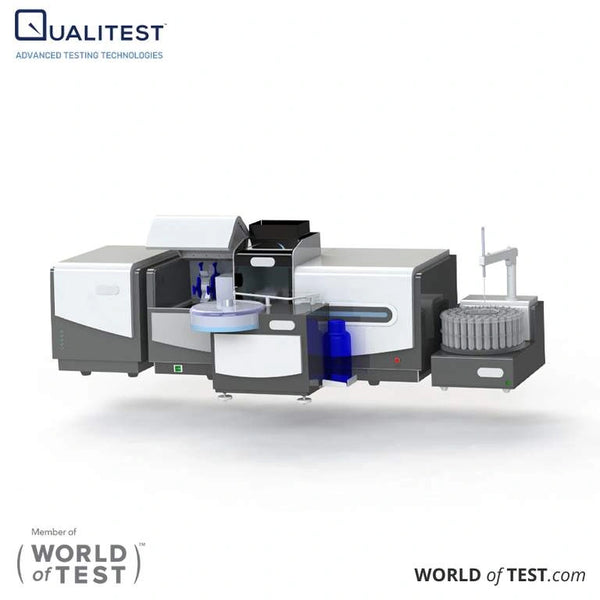
| Recommended Qualitest Equipment | QualiAAS™ 3000F, 3000FG, 3000FG-Pro, QT-AAS29, QT-AAS30, QT-AAS60 | Qualitest PLASMA 1500, PLASMA 2000, PLASMA 3000 |
Core Analytical Principles: ICP OES vs AAS
The mechanical divide in ICP OES vs AAS starts with how each system vaporizes, excites, and optically measures target analytes.
Atomic Absorption Spectrometry (QT-AAS Series)
Our QT-AAS instruments operate on ground-state light absorption physics. Free ground-state atoms in a gaseous state absorb characteristic resonance wavelengths of light emitted by an element-specific hollow cathode lamp, where the degree of light absorbed correlates directly with analyte concentration.
While general spectroscopy literature references flame temperatures reaching 2300–2900 °C across diverse fuel mixtures, our QT-AAS flame system is specifically configured for air-C₂H₂ combustion to measure absorption for routine metals one element at a time.
Modular Atomization Modes
To accommodate different sample matrices and concentration ranges, our QT-AAS hardware configures into three distinct atomization pathways:
- Air-Acetylene Flame: Reaches approximately 2,300 °C over a corrosion-resistant 10 cm Titanium burner head featuring automated height and angle adjustments.
- Graphite Furnace: Electrically heated using longitudinally or transversely heated graphite tubes for high-sensitivity trace testing and higher thermal dissociation.
- Hydride Generation: An optional modular setup dedicated to volatile and hydride-forming elements.
All-Reflective Optical Architecture
Optically, the QT-AAS Series uses a lens-free, all-reflective mirror layout paired with an 1800 grooves/mm diffraction grating covering a 190–900 nm wavelength range in single-beam (3000F, QT-AAS29/30/60) or double-beam (3000FG/Pro, QT-AAS29/30/60) pathways. Automated spectral bandwidth selection includes 0.1 / 0.2 / 0.4 / 0.8 / 1.6 nm on QualiAAS™ and 0.1 / 0.2 / 0.4 / 0.7 / 1.4 nm on QT-AAS29/30/60 instruments.
In our assessment, replacing standard refractive lenses with an all-reflective mirror design is a genuinely clever engineering choice because it eliminates chromatic aberration across that entire 190–900 nm span. Baseline background signals are corrected via a standard Deuterium lamp or self-absorption background correction on FG/Pro and double-beam configurations.
Inductively Coupled Plasma (PLASMA Series)
Our PLASMA Series instruments utilize an intensely energetic discharge to atomize and excite sample constituents. A 27.12 MHz solid-state Radio Frequency (RF) generator delivers 800W to 1600W continuous energy output (with real-time 1W tuning) to sustain an argon gas torch reaching approximately 10,000 Kelvin.
Independent spectroscopy research highlights that argon plasmas operating at 8000–10000 K efficiently atomize, excite, and ionize elements, stimulating characteristic emission lines that facilitate simultaneous multi-element quantification.
We consider real-time 1W adjustments an exceptionally valuable asset for keeping that 10,000 Kelvin discharge rock-steady across variable sample introductions. Academic soil studies observe that this extreme thermal environment can liberate organically bound micronutrients that chemical flames cannot fully dissociate, occasionally yielding systematically higher concentration readings in specific sample matrices.
The Four Thermodynamic Sample Transitions
When liquid aerosol generated by the nebulizer enters the argon torch, it progresses through four rapid transitions:
- Desolvation: Solvent boils away from the fine aerosol droplets, leaving solid micro-particulates.
- Vaporization & Atomization: Solid particulate matter breaks down into free gaseous atoms.
- Ionization & Thermal Excitation: Thermal energy shoves outer electrons up into elevated orbital energy states.
- Photon Emission: Relaxing electrons return to ground state, dumping photons at quantized, element-specific wavelengths where total counts correlate directly with concentration across a broad linear dynamic range.
Dispersion Optics and Dual-View Detection
For optical dispersion, the PLASMA 1500 uses a Czerny-Turner layout with double holographic gratings for high-resolution single-channel scanning, while the PLASMA 2000 and PLASMA 3000 rely on an Echelle Polychromator layout paired with crossed prism dispersion across a 165–900 nm span. Emitted photons strike large-area solid-state CCD arrays stabilized by triple-stage Peltier cooling down to -30°C, or dual-channel photomultiplier tubes (PMT).
Viewing configurations include axial, radial, and vertical torch dual view equipped with a cooled cone interface (PLASMA 3000). We consider the cooled cone interface on the PLASMA 3000 an elegant engineering solution for stripping away recombination interference from the cooler plasma tail.
Workflow and Sample Throughput
Daily testing pace highlights a decisive operational factor. The optical layout directly dictates how quickly your laboratory clears analytical batches.
Sequential Analysis (QT-AAS Series)
The QT-AAS platform measures target analytes sequentially, indexing through hollow cathode lamps using a vertical 4-lamp or 8-lamp auto turret rotating 360° (or an auto multi-lamp turret on QualiAAS™ models).
Comparative evaluations indicate that AAS is inherently paced by sequential element determination, requiring hollow cathode lamp exchanges and differing flame chemistries when evaluating diverse element suites.
Facilities can automate testing runs via an optional 70-sample autosampler on QualiAAS™ configurations, managed through an MS Windows PC environment running RGWIN AAS software equipped with built-in QA/QC functions, automated pneumatic control, flame monitoring, and graphite tube self-inspections.
Consider an in-house quality control team at an American industrial plant analyzing 20 to 30 routine production batches a day for a set panel of two or three specific metals. In this operational context, sequential lamp indexing provides a clean, dependable workflow that avoids unnecessary operational friction.
Simultaneous Screening (PLASMA Series)
The PLASMA 2000 and PLASMA 3000 project the complete emission spectrum across large-area solid-state CCD arrays using an Echelle grating and crossed prism assembly. CCD pixels convert photon intensities across all target wavelengths into digital counts in a single exposure, delivering accelerated analysis speed and quick quantitative readouts across metal elements and select nonmetals.
Spectroscopy literature confirms that ICP-OES covers analytical concentration ranges comparable to AAS while delivering a decisive operational throughput advantage whenever sample protocols require quantifying five or more elements simultaneously. Built-in background-subtraction algorithms strip away continuum emissions and background interference during the analytical run.
By contrast, consider a commercial environmental contract testing laboratory in the United States receiving multiple shipments of industrial wastewater samples daily, where clients demand turnaround on fifteen distinct elements per bottle. In our assessment, single-exposure CCD acquisition is clearly the most logical route to prevent laboratory bottlenecks.
Comparative Research and Matrix Performance
Third-party scientific investigations comparing AAS and ICP-OES on identical sample matrices highlight that analytical comparability depends on sample preparation, digestion protocol, and matrix composition.
(Please note: The following external peer-reviewed studies evaluated third-party laboratory equipment and standardized reference materials, rather than Qualitest commercial product lines.)
Published Analytical Comparisons
In heavy metal monitoring of textile wastewater, both analytical approaches demonstrated linear regression coefficients (R² > 0.995), precision (%RSD ≤ 2%), and recovery rates between 93% and 105% for chromium and lead, although subtle, statistically significant differences between instrument datasets were detected (p = 0.012).
In agricultural and biological substrates, matrix interactions become even more apparent. In DTPA-extractable soil micronutrient testing across diverse soil orders, analytical outcomes were influenced by extraction dynamics; ICP-OES registered higher extractable Fe in Alfisols, whereas AAS yielded higher Fe and Zn values in Vertisols.
Furthermore, in determining cadmium accumulation across plant tissues, ICP-OES delivered a faster, less cumbersome analytical workflow, while graphite furnace AAS offered lower operational expense and distinct precision for very low (<10 mg/kg) or very elevated (>550 mg/kg) cadmium concentrations.
Interference Profiles and Matrix Handling
For laboratory decision-makers evaluating equipment options, interferences are not merely academic concepts; they directly dictate daily sample preparation labor, technician training requirements, and analytical turnaround times.
Evaluating how each platform handles matrix interferences explains why identical samples can yield subtle variance across testing methods.
AAS Operational Trade-Off
Because hollow cathode lamps emit narrow, element-specific resonance lines, direct spectral overlap is exceptionally rare in Atomic Absorption Spectrometry, meaning initial optical method setup is straightforward. However, chemical and physical interferences inside the burner require active technician intervention during sample preparation:
- Manual Chemical Additive Labor: When thermally stable compounds form in the burner (such as phosphates binding with calcium), technicians must manually treat every sample and calibration blank with chemical releasing agents before aspiration.
- Ionization Suppression Spikes: Samples containing high concentrations of alkali metals can alter ground-state atom populations in the flame, requiring staff to add ionization suppression buffers to prevent signal drift.
- Automated Smoke and Background Handling: For dense matrix smoke and non-specific light scattering, our QT-AAS hardware eliminates manual compensation by applying automated Deuterium lamp correction or self-absorption background correction on double-beam configurations.
ICP-OES Operational Trade-Off
Because an argon plasma generates thousands of emission lines across a 165 to 900 nm range, Inductively Coupled Plasma completely eliminates the ongoing bench labor of adding chemical releasing agents. Instead, operational diligence shifts to initial software and optical method configuration:
- Digital Spectral Line Management: When matrix elements emit wavelengths adjacent to target analytes, operators bypass line overlap digitally by choosing alternative, interference-free emission lines across the detector array or activating automated background-subtraction algorithms.
- High-Dissolved-Solids Protection: Heavy production sludges or high-salinity brines can induce physical matrix suppression. Our PLASMA Series handles these matrices using radial optical viewing or the PLASMA 3000 vertical torch dual view equipped with a cooled cone interface, stripping away recombination interference from the cooler plasma tail without forcing technicians to perform manual sample dilutions that compromise detection limits.
US Industry Applications: The Difference Between AAS and ICP OES
Building on these scientific baselines, our instrument families process challenging sample profiles across key American industrial sectors, clarifying the practical difference between AAS and ICP OES.
Environmental Water and Wastewater
Consider an American municipal water district monitoring community drinking water lines alongside commercial environmental facilities tracking industrial outfalls. The choice between technologies maps directly to analytical volume and element lists.
Drinking Water Compliance vs. High-Volume Runoff
- Targeted Trace Compliance (QT-AAS Series): Configured for EPA and ISO 15586 compliance methods for water and soil testing. It provides trace quantification for regulated toxic metals such as lead (Pb), cadmium (Cd), arsenic (As), and mercury (Hg), reaching parts-per-billion (ppb) and parts-per-trillion (ppt) ranges via graphite furnace or optional hydride generation atomization modes.
- High-Volume Runoff Screening (PLASMA Series): Engineered for regional contract testing laboratories running multi-element suites under industry guidelines like ASTM D1976 and EPA water methods. Axial viewing captures trace ppb concentrations across high-volume discharge profiles, while automated background-subtraction algorithms resolve spectral overlap in complex aqueous runoff.
Pharmaceuticals and API Verification
Pharmaceutical quality control units and contract development and manufacturing organizations (CDMOs) face rigorous data integrity and elemental impurity benchmarks.
Targeted Impurities vs. Broad Solution Screening
- API Raw Material Verification (QT-AAS Series): Built to satisfy USP, EP, and FDA 21 CFR criteria for specific toxic contaminants and nutritional minerals, including Pb, Cd, As, Hg, Cr, Ca, Mg, K, Fe, Mn, Zn, and Cu. We believe the built-in QA/QC routines inside RGWIN AAS software running on MS Windows save laboratory supervisors substantial administrative effort during formal FDA audits.
- Multi-Element Solution Screening (PLASMA Series): Serves the broader pharmaceutical testing sector by delivering rapid quantitative readouts across metallic elements in solution during preliminary formulations or process evaluations.
Cannabis and Hemp Testing
State-licensed analytical testing laboratories in markets with established regulatory structures (such as California, Colorado, or Michigan) are legally mandated to verify consumer safety under strict action levels.
Meeting State Action Levels with Focused Infrastructure
- Matrix Scope: Processes cannabis flower, liquid concentrates, hydrocarbon extracts, and finished consumer goods.
- Target Analytes: Mandatory heavy metal safety panels covering lead (Pb), cadmium (Cd), arsenic (As), and mercury (Hg).
- Instrumentation Fit: Graphite furnace AAS is an economical choice for low-to-moderate batch volumes, reaching state-mandated ppb and ppt action levels cleanly.
- Operational & Regulatory Realities: Sequential testing requires four furnace cycles per sample for a four-metal panel. Accredited commercial facilities should confirm approved state method lists prior to selection. (Cannabis matrices are not part of the published PLASMA Series application profile; consult our specialists for feasibility).
Petrochemicals, Mining, and Refining
Refining corridors along the US Gulf Coast and mining operations require instrumentation that withstands demanding chemical matrices without excessive downtime.
Process Stream Monitoring vs. High-Dissolved-Solids
- Refinery Feedstocks and Catalysts (QT-AAS Series): Handles incoming crude oil, refined fuels, lubricants, refinery feedstocks, catalysts, ores, minerals, metals, and alloys through flame or graphite furnace atomization.
- Heavy Sludges and Saline Brines (PLASMA Series): Built to process volatile organic solvents, heavy production sludges, and high-salinity oilfield brines. The vertical torch dual view on the PLASMA 3000 uses a cooled cone interface to eliminate recombination interference from the cooler plasma tail, maintaining stable run profiles across heavy geological and metallurgical matrices.
Operational Economics and Ownership Costs
Evaluating equipment options requires reviewing routine utility requirements and consumable wear items. In peer-reviewed instrumentation reviews, AAS is widely recognized for lower initial capital acquisition expenses and economical maintenance. We structure both product lines as cost-effective products to ensure operating budgets remain sustainable over time.
Gas Demands and Hardware Consumables
The QT-AAS Series consumes acetylene (C₂H₂), compressed air (for air-C₂H₂ flame operation), and argon (Ar). Hardware wear components include the 10 cm Titanium burner head, longitudinally or transversely heated graphite tubes, and individual hollow cathode lamps housed in vertical 4-lamp or 8-lamp auto turrets rotating 360° (or an auto multi-lamp turret on QualiAAS™ models).
Automated pneumatic controls, auto-ignition, acetylene leak warnings, and gas line pressure interlocks prevent gas loss and protect the system. In our view, automated acetylene leak alerts and pressure shutoffs are vital baseline safety features when storing combustible fuel cylinders.
By comparison, the PLASMA Series operates on argon (Ar), utilizing mass flow controllers (MFC) to regulate carrier, auxiliary, and cooling flows through an argon torch, nebulizer, and cooled cone interface. Across the analytical testing industry, sustained plasma generation represents the primary ongoing utility expense for ICP-OES: standard torch assemblies consume roughly 15 to 20 L/min of total argon across plasma, nebulizer, and auxiliary streams while operating.
From an ownership perspective, this establishes a clear economic dividing line: Flame AAS incurs utility costs strictly during active aspiration cycles, making it exceptionally economical for smaller, dedicated sample runs.
Conversely, while an ICP-OES demands higher continuous gas supply infrastructure, such as liquid argon dewars for high-volume facilities, it dramatically reduces the net cost per analyte determination once a laboratory processes multi-element suites across high daily sample volumes.
Facility Electrical Integration
The QT-AAS Series features a dual 110/220 V, 50/60 Hz electrical input across models like the QT-AAS29, QT-AAS30, and QT-AAS60, allowing direct connection to standard North American 120 V / 60 Hz bench receptacles with no dedicated branch circuit installation or frequency conversion required. (For the QualiAAS 3000 Series, base factory units specify 220 V / 50 Hz, with 110 V configurations available for North American deployment).
Consider a facility manager setting up a testing suite inside a standard US commercial real estate building or technology park incubator space: direct plug-in compatibility avoids substantial capital expense, administrative delays, and contractor bills associated with pulling dedicated lines.
The PLASMA Series demands electrical infrastructure supporting a 27.12 MHz solid-state RF generator running between 800W to 1600W continuous energy output, alongside electrical supply for triple-stage Peltier cooling down to -30°C. Incoming electrical supply connections are established during facility site preparation, and testing facilities should consult our engineering team for exact line voltage requirements.
Strategic Equipment Selection
Independent analytical literature confirms that optimal instrument selection is governed by analyte panel size, sample throughput requirements, and matrix composition.
When five or more elements must be determined per sample, or when wide linear dynamic ranges are necessary, ICP-OES represents the logical choice. Conversely, for single-element or few-element panels, AAS remains an exceptionally economical and sensitive methodology.
To help you select the appropriate platform, here is how our hardware capabilities compare:
| Selection Criteria | Qualitest QT-AAS Series (AAS) | Qualitest PLASMA Series (ICP-OES) |
|---|---|---|
| Analytical Principle | Ground-state light absorption using element-specific hollow cathode lamps | High-temperature argon plasma excitation (approximately 10,000 Kelvin) |
| Wavelength Range | 190–900 nm (1800 grooves/mm reflective grating) | 165–900 nm (Czerny-Turner or Echelle Polychromator with crossed prism) |
| Detection Limits | Parts-per-billion (ppb) to parts-per-trillion (ppt) (mode dependent) | Parts-per-billion (ppb) trace levels under axial view; lower detection limit on PLASMA 2000 |
| Analyte Capacity | 70+ metallic and non-metallic elements | Complete coverage across all metal elements and select nonmetals |
| Sample Throughput | Sequential determination; automated via 70-sample autosampler (QualiAAS™) | Simultaneous full-spectrum CCD single exposure; accelerated analysis speed |
| Sample Matrices | Aqueous solutions, API raw materials, cannabis flower/extracts, soils, crude oils | Aqueous and organic liquids, volatile organic solvents, high-salinity brines, heavy sludges |
| Facility Hookup (US) | Dual 110/220 V, 50/60 Hz input (QT-AAS Series); QualiAAS 3000 base spec 220 V / 50 Hz (110 V available) | 27.12 MHz solid-state RF generator (800W to 1600W continuous energy output; voltage confirmed per site preparation review) |
| Documented Standards | EPA, ASTM D1976, ISO 15586, USP, EP, FDA 21 CFR, state/federal cannabis rules | Industry-standard platform for ASTM D1976 and EPA water methods; specific factory compliance packages confirmed upon request |
Final Recommendations
Balancing elemental spectroscopy options centers on matching target analyte scope, detection limits, and lab infrastructure:
- Select the Qualitest QT-AAS Series if your facility requires a cost-effective workhorse for dedicated panels across 70+ elements down to ppb or ppt levels, requires direct North American 110/220 V, 50/60 Hz electrical compatibility, or must verify documented compliance with EPA, ISO 15586, USP, EP, or FDA 21 CFR requirements across soils, APIs, petrochemicals, or cannabis products.
- Select the Qualitest PLASMA Series if your daily testing program demands high-throughput screening across all metals and select nonmetals, requires accelerated analysis speed via simultaneous CCD single-exposure detection across 165–900 nm, or regularly encounters complex matrices like volatile organic solvents, heavy sludges, and high-salinity brines via cooled-cone dual-view optics.
Choosing Between AAS and ICP OES with Qualitest
Selecting an analytical spectrometer is an important technical commitment that should always be grounded in hard data. At Qualitest, our technical specialists are ready to evaluate your sample matrices, target detection levels, and facility utilities to configure an optimal solution.
Contact Qualitest today to discuss your analytical goals, review our cost-effective products, and request an official quote on our QT-AAS Series or PLASMA Series spectrometers.
References (Click to expand)
- Chen, K., Mou, P., Zhu, A., Chen, P., Chen, J., Gao, G., Wang, X.-F., Feng, X., & Yu, C.-M. (2023). A comparative study of different methods for the determination of cadmium in various tissues of ramie (Boehmeria nivea L.). Environmental Monitoring and Assessment, 195.
- Galdino, J. N., & César, I. C. (2026). Comparison of Analytical Methods for the Determination of Elemental Impurities in Pharmaceutical Products. Critical Reviews in Analytical Chemistry, 1-13.
- Kuai, L., Li, H., Liu, J., & Tang, S. (2023). Application and Development Trends of Spectral Analysis in Draft of Non-Ferrous Metal Standards in China. American Journal of Analytical Chemistry.
- Shawkat, S. F., Ahmed, S., & Nadeem, S. (2025). Which Is More Reliable? ICP-OES vs AAS for Chromium and Lead Analysis in Heavy Metal Monitoring. Journal of Chemical Learning Innovation.
- Sunitha, M., Sahrawat, K., & Wani, S. (2015). Comparative Evaluation of Inductively Coupled Plasma–Optical Emission Spectroscopy and Atomic Absorption Spectrophotometry for Determining DTPA-Extractable Micronutrients in Soils. Communications in Soil Science and Plant Analysis, 46, 627-632.