Ever wondered how much pressure your materials can take before they bend for good or snap entirely?
In the daily grind of production, knowing these limits is the whole game. That is exactly why folks on the floor keep a close eye on ultimate tensile strength and yield strength.
Let’s look at why knowing the difference between yield strength and ultimate tensile strength is the secret to building gear that survives when the pressure starts to climb.
Quick Comparison: UTS vs Yield Strength
| The Details | Yield Strength | Ultimate Tensile Strength (UTS) |
|---|---|---|
| The Bottom Line | The absolute most weight a part carries before it stays bent. | The absolute most weight a part carries before it rips into pieces. |
| What Happens to the Material? | It takes a permanent, ugly dent but stays in one piece. | Total structural collapse: the material tears open or snaps. |
| Location on the Test Curve | Right where the rising line flattens out. | The absolute highest peak of the entire graph. |
| Why Engineers Care | Sets the strict "safe zone" limits for normal, daily operation. | Acts as the ultimate safety net for massive, unexpected accidents. |
Defining Yield Strength
Think about pulling on a heavy-duty industrial component. Here is how it reacts as the pressure builds:
- The Snap-Back Phase: At first, even if it stretches a tiny bit, it zips right back to its original shape the moment you let go. The technical crowd calls this elastic deformation.
- Hitting the Wall: If you keep piling on the weight, that material eventually hits a spot where it simply cannot return to its original form.
- The Point of No Return: This is the stress level where a material begins to deform plastically. It ends up permanently bent or stretched out of shape.
The specific amount of heavy lifting a material handles before it hits that permanent stretch is the yield strength. When you are drawing up your blueprints, yield strength is usually the number that carries the most weight because it defines the limit of "normal" behavior.
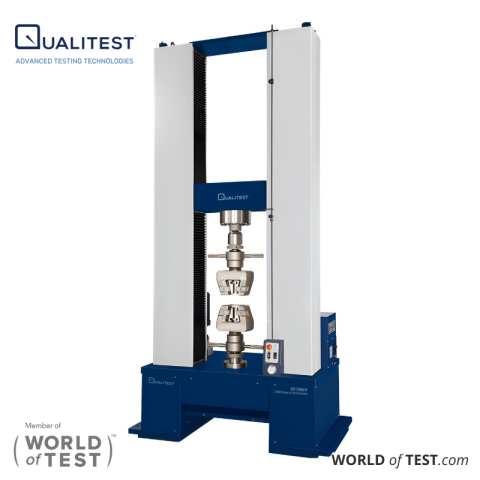
In fact, to find that exact limit for massive components, shops often fire up heavy-duty rigs like our Universal Mechanical Testing Machines - QM 100-600kN to safely push the metal right to the edge.
We are going to go out on a limb and say it: staking your reputation on yield strength is the smartest way to ensure your gear stays solid for the long haul.
Defining Ultimate Tensile Strength (UTS)
If you keep cranking up the tension past that yield point, the material just keeps stretching and getting thinner. Eventually, it hits the absolute highest peak of stress it can survive before it literally pulls apart or snaps.
That "end of the line" limit is the ultimate tensile strength (or just UTS for those who prefer the shorthand). Here is how it stacks up against the earlier stages of stress:
- The Final Limit: UTS is the maximum stress a material can withstand while being stretched before necking occurs.
- The Emergency Threshold: While yield strength marks the end of the "no harm, no foul" stage, ultimate tensile strength is the literal point of total failure.
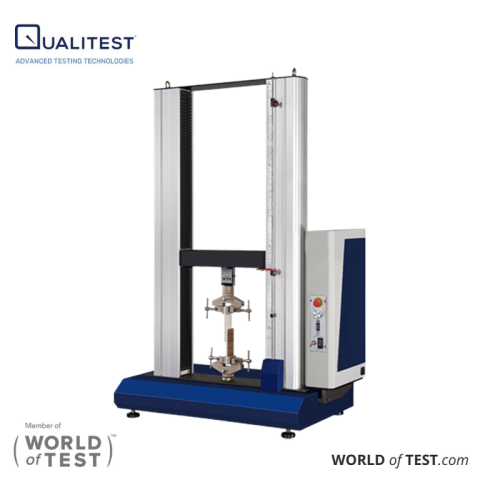
Finding that massive breaking point requires serious pulling muscle, which is exactly why testing facilities use equipment like our 3000 kN Universal Testing Machine - QTM-3000 to tear through high-strength industrial cables.
We are convinced that while yield strength prevents your products from warping during a normal workday, UTS is the ultimate safety net that keeps your brand's name out of the mud.
The Stress-Strain Curve
To really wrap your head around ultimate tensile strength and yield strength, you have to look at a stress strain curve. During a physical pull test on highly sensitive equipment like our Servo Hydraulic Universal Testing Machine - QT-HW2, the computer tracks the heavy pressure (the stress) against how much the material actually stretches (the strain).
We find that a solid stress strain curve explanation is like a cheat sheet for a material's life story.
Related article: Guide: How to Calculate Strain Rate in Tensile Test
If you have ever asked, "what is stress strain curve testing actually showing us?" here is the step-by-step breakdown of that tracking line based on established structural models:
1. Elastic Deformation:
This is the steep, straight upward path right at the beginning where stress and strain are proportional. The material is getting stretched out, but it still holds onto enough fight to snap right back to its normal state the second you drop the load.
2. The Yield Point
This is the exact spot where the climbing line suddenly starts to flatten out, marking the transition to plastic deformation. In some steels, a "yield plateau" may be present, where the stress stays nearly constant for a bit before it starts climbing again.
3. Strain Hardening
The tracking curve arcs back up toward the sky while the material gets temporarily tougher but stays stretched out for good. The material is essentially getting stronger as it deforms, leading up to its maximum capacity.
4. Ultimate Strength Peak
The very highest tip of the visual hill on your stress strain curve. That is the UTS. It stands as the absolute maximum amount of punishment the component can survive before necking begins.
5. Necking and Final Fracture
After cruising past the peak UTS, the material gets dangerously skinny in the middle section (necking). The tracking line drops fast until the whole thing finally goes pop and breaks into pieces.
Engineering vs. True Stress-Strain Curves
It is worth noting that the curves most people see are "engineering" curves, but they do not tell the whole story.
True stress-strain curves differ because they account for the actual cross-sectional area as the material thins out during deformation. Because the area gets smaller, true stress-strain curves actually show higher maximum stresses than the engineering versions we usually look at.
Modeling Nonlinear Behavior
For materials that do not follow a simple straight line, engineers use models like the Ramberg-Osgood relationship to describe how stress and strain interact beyond the yield point. These models are adapted to handle materials with different ductility levels or those that show Luder's strain.
Gaining a clear grip on these curves is vital for predicting how a structure will act under heavy loads in real-world jobs.
Difference Between Ultimate Tensile Strength and Yield Strength
To put the difference between ultimate tensile strength and yield strength in plain language, think of it as the gap between getting a permanent dent and having the whole thing shatter.
The Forklift Scenario:
- Picture a busy warehouse where a careless forklift driver bumps hard into a tall storage rack.
- Yield strength dictates whether the metal strut takes a permanent, ugly dent.
- Ultimate tensile strength dictates whether that strut tears completely open, sending shelves of inventory crashing to the floor.
When you are weighing ultimate tensile strength vs yield strength, you have to keep in mind that they are two totally different chapters in a material’s life story.
For example, a really stretchy metal might have a low yield strength but a massive UTS—it will bend if you look at it funny, but it is a total beast to actually snap.
Strategic Value of Measuring Both
When you are looking at yield strength and ultimate tensile strength, it is not about which one is "better"—they both tell a different part of the story. Designers use yield strength to figure out the "safe zone" for a product, while UTS is reserved for "worst-case" moments.
The Airplane Wing Scenario:
- Look at the wings of a commercial passenger jet.
- Engineers specify a high yield strength so the wings can flex during flight turbulence without staying permanently bent.
- However, they also calculate the UTS for catastrophic moments, like a massive bird strike, to ensure the wing stays attached to the plane even after taking critical damage.
We are sticking to our guns here: checking both is the only way to see exactly what a material is made of.
Industry Material Benchmarks
| Material | Yield Strength (The Bending Point) | Ultimate Tensile Strength (The Breaking Point) | How it Acts |
|---|---|---|---|
| Standard Steel (A36) | 250 MPa | 400 - 550 MPa | Totally tough and stretchy: a huge gap between bending and breaking. |
| Aluminum (6061-T6) | 276 MPa | 310 MPa | Tight numbers: doesn't stretch much before it lets go. |
| Carbon Fiber | N/A (Just snaps) | 600 - 1000+ MPa | Super brittle: no warning, it just shatters at the top. |
- Standard Steel (A36): Builders use this for massive bridge supports because it bends significantly before breaking, giving a visual warning (sagging) long before a collapse.
- Aluminum (6061-T6): Perfect for aircraft fuselages where you need the structure to hold its exact shape under pressure without adding bulk.
- Carbon Fiber: Saved for high-speed racing chassis where extreme stiffness carries far more value than flexibility.
Environmental Impact on Material Strength
Don't forget that how strong something is can change on a dime. Several factors can totally swap the difference between yield strength and ultimate tensile strength:
- The Weather: High heat usually makes things weaker but much stretchier. Cold can make things feel stronger, but they get way more brittle. One good whack and they shatter like glass.
- Heat Treatment: Specific thermal processes can drop the yield strength to make it easier to work with, while other methods can send both numbers through the roof.
- Cold Working: Hammering or rolling metal while it is cold builds up its yield strength, pushing it closer to that breaking point.
Testing Procedures and Standards
To find these numbers for real, you have to put samples through the wringer. For businesses that need to play by the rules, checking things the right way is everything. You have to follow the big international rulebooks like:
- ASTM E8 / E8M: The go-to for checking how metals pull apart.
- ISO 527: The standard for seeing how plastics hold up.
- ASTM D638: Another big one for testing plastic parts.
To hit those exact plastic testing specs without a hitch, labs frequently turn to compact setups like our Benchtop Tensile Testing Machine - QTens-I or the Universal Testing Machine QM-200N.
For heavier metal tests, the versatile Tensile and Compression Testing Machine - QM-20 handles the load easily. We are big believers that having the right gear is not just another bill to pay: it is how you sleep better at night knowing your quality is spot on.
Related article: Tensile Testing vs. Compression Testing Comparison
Quality Control Made Affordable with Qualitest UTMs
At Qualitest, we know your reputation hangs on how well your builds hold up under pressure.
You should not have to pay a king's ransom for gear that delivers results. We offer cost-effective testing equipment that nails the accuracy you need without the extra headaches.
Take a look at our full lineup of Universal Testing Machines right now and let’s start building stuff that survives anything.
References ⏷
- Dissanayake, L., Walport, F., Yun, X., & Gardner, L. (2025). Unified stress-strain models for normal and high strength steels. Construction and Building Materials.
- Faridmehr, I., Osman, M., Adnan, A., Nejad, A., Hodjati, R., & Azimi, M. (2014). Correlation between Engineering Stress-Strain and True Stress-Strain Curve. American Journal of Civil Engineering and Architecture, 2, 53-59.
- Kujawski, D., Patwardhan, P., & Nalavde, R. (2020). An estimation of true Ramberg‐Osgood curve parameters for materials with and without Luder's strain using yield and ultimate strengths. Fatigue & Fracture of Engineering Materials & Structures, 43, 2147-2156.
- Patwardhan, P., Nalavde, R., & Kujawski, D. (2019). An Estimation of Ramberg-Osgood Constants for Materials with and without Luder’s Strain Using Yield and Ultimate Strengths. Procedia Structural Integrity.
- Yun, X., & Gardner, L. (2017). Stress-strain curves for hot-rolled steels. Journal of Constructional Steel Research, 133, 36-46.